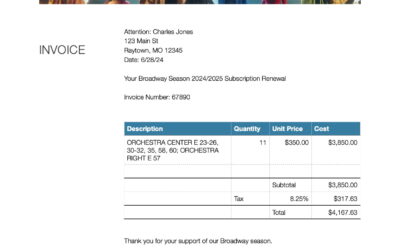
Creating a SQL Query to Group and Format Seat Data
At one point in my career, I needed to create invoices with dynamic data from a live event ticketing system which contained Broadway season subscription data. Specifically, the invoices needed to show assigned seats in an easy to read format for the customer that...

Facebook Ads Just Don’t Work For Me
Over the past few weeks, I’ve been running Facebook ads for my children’s book and print-on-demand products without much success. It turns out that running Facebook ads is similar to placing an ad in a magazine at a doctor’s office. Readers might glance at the content...

New Website For Author D.J. Ciccarello
I'm excited to share my recent website project for D.J. Ciccarello, a talented author based in Atlanta, who has recently launched his debut novel! Having delved into his captivating work myself, I eagerly anticipate his forthcoming books scheduled for release later...
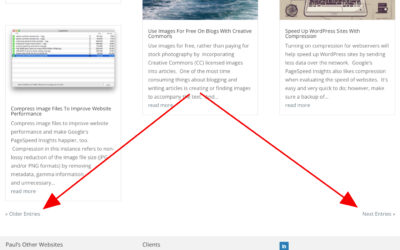
Divi Blog Module – How to change the Older / Next Entries Navigation Link Text
The inability to easily change the "older/newer posts" text displayed by default in the Divi Blog Post module is quite annoying; however, there is a relatively simple solution available using CSS. To make this work, place the following CSS in the custom CSS input...
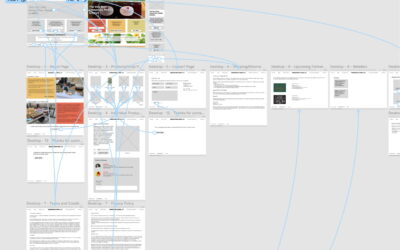
Using Figma To Design A New Website Wireframe
A new jam, pickle and relish business recently asked me to design and develop a website to showcase and sell their products online. Previously, I had done wireframes with paper and pencil but decided to give Figma a try. At first, the really simple interface didn't...

GUID On SQL Server Tables – Auto-Generated Sequence
Since generated GUID (globally unique identifier) values are considered to be unique across all databases and servers, they are great for assigning row ids that will never be duplicated anywhere else. However, the values generated for GUID are not user friendly, so...
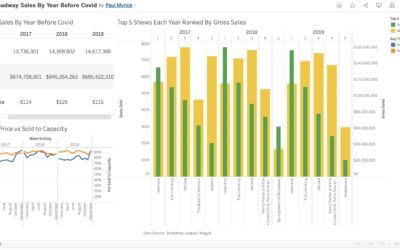
Tableau Dashboard For Broadway Sales
A Tableau dashboard I created showing Broadway show sales (New York only) pre-covid. Sales for the top five shows in 2017, 2018 and 2019 are also shown. This embedded dashboard works best in full-screen mode.

Broadway Show Dashboard Created In Tableau Public
Here's a Broadway show dashboard I built in Tableau Public with dummy data depicting percent sold out (ticket sales vs. capacity), revenue, holds and average ticket price. All information shown here is completely fictitious and is for demonstration purposes only....

PostgreSQL Database Time Zones and Timestamp Time Zone Conversion in SQL
PostgreSQL stores timestamps with time zones in Greenwich Mean Time (GMT); however, the database can be configured to return timestamps in a different time zone. To set the default time zone for a database, use the ALTER DATABASE command. For example, the following...