by Paul Myrick | Aug 26, 2023 | Tableau
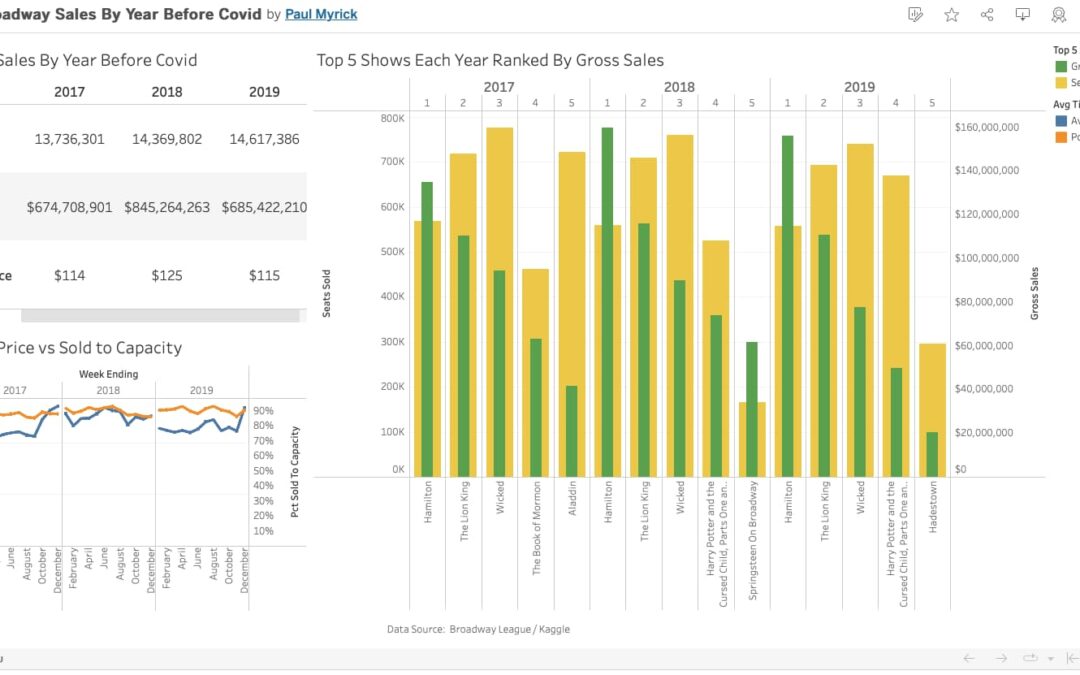
A Tableau dashboard I created showing Broadway show sales (New York only) pre-covid. Sales for the top five shows in 2017, 2018 and 2019 are also shown. This embedded dashboard works best in full-screen...

by Paul Myrick | Aug 16, 2023 | Data Analysis, Reporting, Tableau
Here’s a Broadway show dashboard I built in Tableau Public with dummy data depicting percent sold out (ticket sales vs. capacity), revenue, holds and average ticket price. All information shown here is completely fictitious and is for demonstration purposes...


